Take a run with The Human Potential Running Series podcast. For Episode 57 HPRS Race Director John Lacroix provides his data collection and analysis for ultramarathon running in 2024, and where the sport finds itself today. Less “address” and more conversation amongst friends, John highlights the triumphant year that ultra had and his reasons for being cautiously optimistic with the numbers and the earth-shattering struggles we’re about to face with permitting.
Around this time every year, I present our community with my “State of Our Sport” address. This year its less “address” and more “conversation” that focuses on the realized history and predicted evolution of ultramarathon running in the year that’s passed and the year(s) to come. This year’s address seeks to present an opinion based on various facts/data and insights within articles, news stories, industry reports, and interpersonal communications with others in the industry to paint a picture of the trends that some of us see in our sport. This is an opinion piece, an “op-ed.”
I recognize that not everyone will agree with what is spoken or follow the same insight(s) shared, and that’s more than okay. I respectfully ask that those who disagree with anything said address the subject matter they disagree with by presenting their own facts in a rebuttal. Let’s have a respectful conversation about the subject matter that includes evidence that backs up our positions rather than simply attacking the individual providing the narrative.
The discussion herein is based on my interpretations of data given my education, professional experience, and discussions with various industry professionals throughout the calendar year 2024. Sources and interpersonal discussion from conferences and working groups include but are not limited to: Quarterly updates from RunSignUp.Com, Running Insight, Endurance Sportswire, RunningUSA.org, RRCA newsletters, Ultrarunning Magazine, meetings with various board and committees, discussions in a couple of Race Director Groups on Facebook, and various in-person discussions with other trail and ultramarathon race directors, owners, and brand representatives.
2024 DATA
Below are the numbers associated with ultramarathon running over select periods of time[1].The podcast episode features a discussion on these numbers. These numbers are for North America only. When viewing the percentage of change columns, please note that 2019 is compared to 2018, and 2022 is compared to 2019 in recognition of the Covid-19 Pandemic.
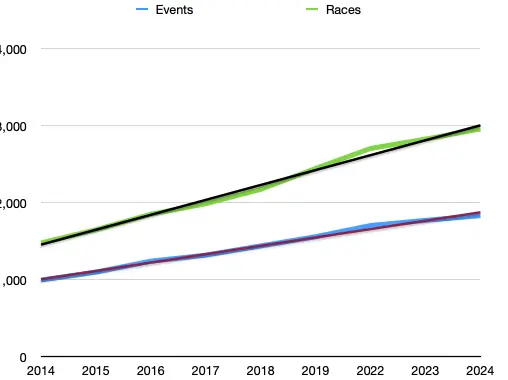
Event and Race Count Trends
| Year | Events | Change | Races | Change |
| 2019 | 1,559 | 8.26% | 2,444 | 11.74% |
| 2020 | 752 | 1,172 | ||
| 2021 | 1,405 | 2,248 | ||
| 2022 | 1,704 | 9.3% | 2,703 | 10.60% |
| 2023 | 1,771 | 3.86% | 2,824 | 4.38% |
| 2024 | 1,832 | 3.39% | 2,956 | 4.57% |
Data from: https://ultrarunning.com/calendar/stats/ultrarunning-finishes?distance=&country=USA
2019 compared to 2018. 2022 compared to 2019. One event can have multiple races. If an event has a 50k, 50-mile and 100-mile, that’s one event with three races.
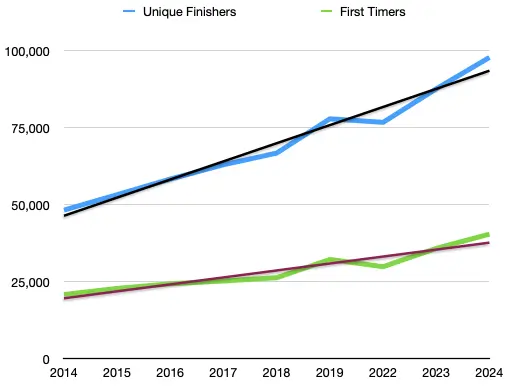
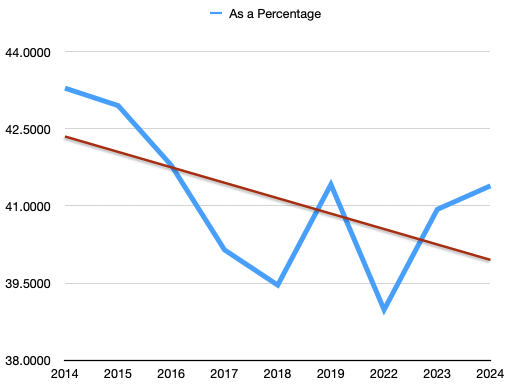
Unique Finishers and First-Timers Trends
| Year | Unique Finishers | Change | First Timers | Change | As A Percentage |
| 2019 | 77,831 | 15.37% | 32,234 | 20.16% | 41.4154 |
| 2020 | 34,760 | 12,005 | 34.5368 | ||
| 2021 | 64,688 | 26,258 | 40.5918 | ||
| 2022 | 76,670 | -1.49% | 29,886 | -7.28% | 38.9800 |
| 2023 | 87,548 | 13.25% | 35,835 | 18.10% | 40.9318 |
| 2024 | 97,730 | 10.99% | 40,450 | 12.1% | 41.3900 |
Data from: https://ultrarunning.com/calendar/stats/ultrarunning-finishes?distance=&country=USA
2019 compared to 2018. 2022 compared to 2019.
Finish Trends
| Year | Total Finishes | Change | Avg. Finishers Per Race | Change |
| 2019 | 129,998 | 13.62% | 53.19 | 1.90% |
| 2020 | 46,838 | 39.96 | ||
| 2021 | 101,610 | 45.2 | ||
| 2022 | 117,718 | -9.45% | 43.55 | -18.12% |
| 2023 | 131,792 | 11.28% | 46.67 | 7.16% |
| 2024 | 143,616 | 8.59% | 48.58 | 4.09% |
Data from: https://ultrarunning.com/calendar/stats/ultrarunning-finishes?distance=&country=USA
2019 compared to 2018. 2022 compared to 2019.
Participation by Gender Trends
| Year | Male | Female | Difference | Change |
| 2014 | 69% | 31% | 38 | -4.86% |
| 2015 | 67.63% | 32.37% | 35.26 | -7.21% |
| 2016 | 66.59% | 33.41% | 33.18 | -5.9% |
| 2017 | 66.29% | 33.71% | 32.58 | -1.81% |
| 2018 | 66.23% | 33.77% | 32.46 | -0.37% |
| 2019 | 66.54% | 33.46% | 33.08 | 1.91% |
| 2020 | 67.9% | 32.1% | 35.8 | 8.22% |
| 2021 | 66.56% | 33.44% | 33.12 | -7.49% |
| 2022 | 66.86% | 33.14% | 33.72 | 1.81% |
| 2023 | 68.19% | 31.81% | 36.38 | 7.89% |
| 2024 | 68.36% | 31.64% | 36.72 | 0.94% |
Data from: https://ultrarunning.com/calendar/stats/ultrarunning-finishes?distance=&country=USA
Number of Races by Distance and Total Finishes By Distance Trends
| Distance | 2024 | 2023 | Change | 2024 Total Finishes | 2023 Total Finishes | Change |
| 50k | 1009 | 961 | 5% | 64,340 | 60,159 | 7% |
| 50-Mile | 344 | 338 | 1.8% | 19,053 | 17,609 | 8.2% |
| 100k | 189 | 177 | 6.8% | 9,055 | 7,514 | 20.5% |
| 100-Mile | 253 | 243 | 4.1% | 12,400 | 11,254 | 10.2% |
| 200-Mile | 18 | 15 | 20% | 505 | 424 | 19.1% |
Data from: https://ultrarunning.com/calendar/stats/ultrarunning-finishes?distance=&country=USA
Number of Races By Distance Trends 1
| 50k | Change | 50-mile | Change | 100k | Change | 100-Mile | Change | 200-Mile | Change | |
| 2019 | 888 | 5.7% | 321 | 11.1% | 168 | 21.7% | 188 | 7.4% | 11 | 83.3% |
| 2020 | 405 | 136 | 77 | 98 | 3 | |||||
| 2021 | 750 | 282 | 147 | 193 | 8 | |||||
| 2022 | 909 | 2.4% | 332 | 3.4% | 178 | 6% | 230 | 22.3% | 9 | -18.2% |
| 2023 | 961 | 5.7% | 338 | 1.8% | 177 | -0.6% | 243 | 5.7% | 15 | 66.7% |
| 2024 | 1009 | 5% | 344 | 1.8% | 189 | 6.8% | 253 | 4.1% | 18 | 20% |
Data from: https://ultrarunning.com/calendar/stats/ultrarunning-finishes?distance=&country=USA
2019 compared to 2018. 2022 compared to 2019.
Finishers By Distance Trends 1
| 50k | Change | 50-Mile | Change | 100k | Change | 100-Mile | Change | 200-Mile | Change | |
| 2019 | 62,853 | 13.5% | 19,044 | 10.2% | 6,916 | 20.2% | 10,168 | 9.6% | 306 | 15.9% |
| 2020 | 21,990 | 6,452 | 2,866 | 3,349 | 18 | |||||
| 2021 | 44,885 | 14,780 | 5,302 | 8,616 | 130 | |||||
| 2022 | 52,254 | -16.9% | 16,295 | -14.5% | 6,552 | -5.3% | 10,329 | 1.6% | 324 | 5.9% |
| 2023 | 60,159 | 15.1% | 17,609 | 8.1% | 7,514 | 14.68% | 11,254 | 9% | 424 | 30.9% |
| 2024 | 64,340 | 7% | 19,053 | 8.2% | 9,055 | 20.5% | 12,400 | 10.2% | 505 | 19.1% |
Data from: https://ultrarunning.com/calendar/stats/ultrarunning-finishes?distance=&country=USA
2019 compared to 2018. 2022 compared to 2019.
Number of Races By Distance Trends 2
| 6-Hour | Change | 12-Hour | Change | 24-Hour | Change | Backyard | Change | |
| 2019 | 151 | 11.85% | 163 | 14.79% | 126 | 22.33% | 30 | 172.73% |
| 2020 | 75 | 85 | 63 | 26 | ||||
| 2021 | 143 | 154 | 121 | 57 | ||||
| 2022 | 178 | 17.88% | 187 | 14.73% | 141 | 11.91% | 76 | 153.33% |
| 2023 | 182 | 2.25% | 204 | 9.1% | 141 | 0% | 88 | 15.79% |
| 2024 | 186 | 2.2% | 229 | 12.26% | 142 | 0.71% | 95 | 7.95% |
Data from: https://ultrarunning.com/calendar/stats/ultrarunning-finishes?distance=&country=USA
2019 compared to 2018. 2022 compared to 2019.
Finishers By Distance Trends 2
| 6-Hour | Change | 12-Hour | Change | 24-Hour | Change | Backyard | Change | |
| 2019 | 1,705 | 12.39% | 4,132 | 22.58% | 4,450 | 23.13% | 1,047 | 112.80% |
| 2020 | 779 | 1,857 | 1,522 | 743 | ||||
| 2021 | 1,550 | 3,719 | 3,714 | 1,644 | ||||
| 2022 | 1,594 | -6.51% | 3,893 | -5.78% | 4,476 | 0.58% | 1,930 | 84.34% |
| 2023 | 1,980 | 24.22% | 4,394 | 12.87% | 4,479 | 0.07% | 2,596 | 34.51% |
| 2024 | 1,989 | 0.46% | 5,205 | 18.46% | 4,753 | 6.12% | 3,251 | 25.23% |
Data from: https://ultrarunning.com/calendar/stats/ultrarunning-finishes?distance=&country=USA
2019 compared to 2018. 2022 compared to 2019.